Solivia Monitor
System Documentation
A complete reference for every module, interface element, and workflow within the Solivia Monitor platform. This guide covers all functional areas of the application, providing descriptions of screens, controls, and data fields.
Navigation Sidebar
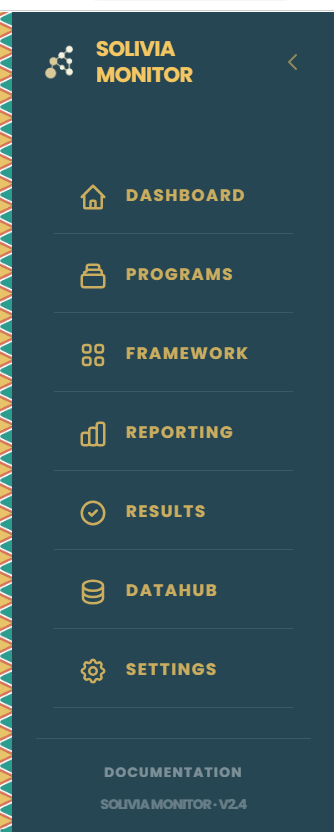
The sidebar is persistently visible across all application views and provides access to every functional module. The organisation logo and name are displayed at the top. Navigation links are ordered by operational workflow — from portfolio overview through project management, strategic framework modelling, periodic reporting, scorecard analytics, data centralization, and administrative settings.
Organisation Dashboard
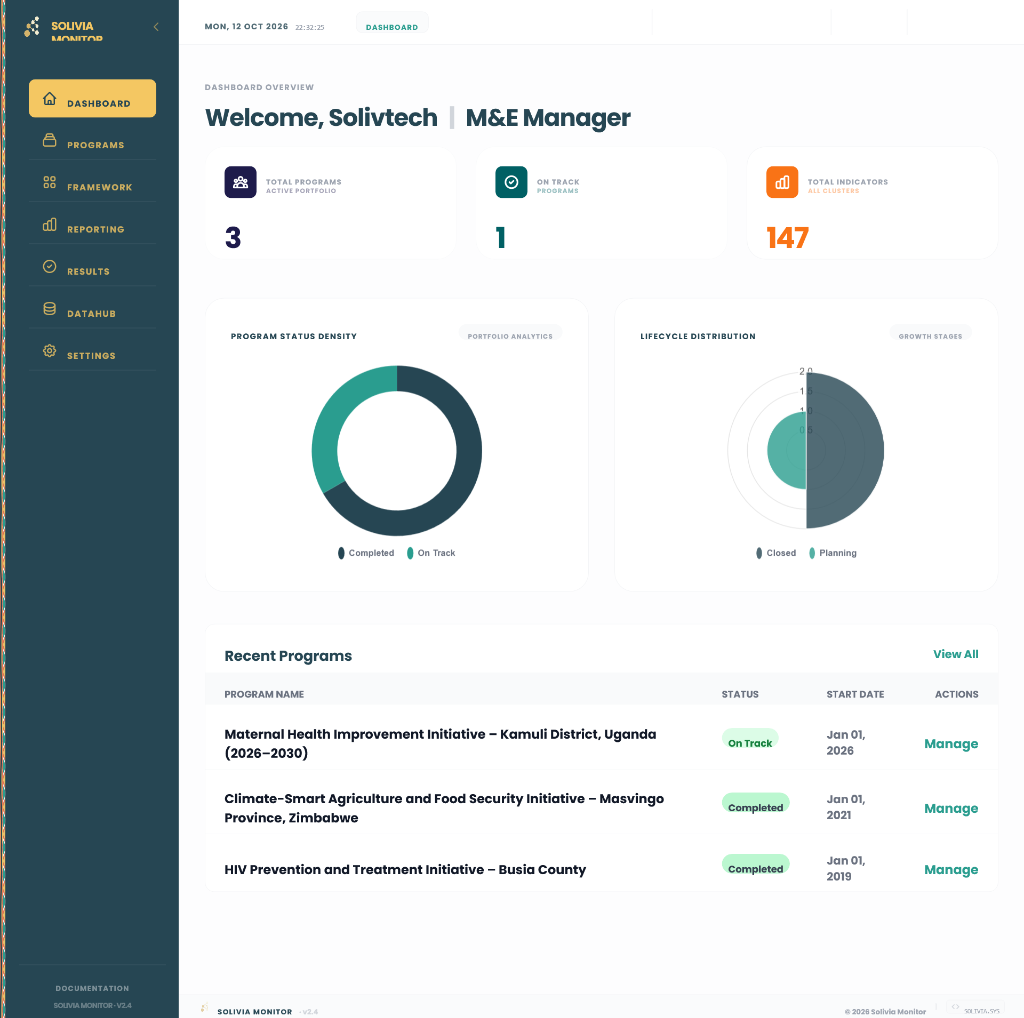
The Dashboard is the primary landing screen following authentication. It presents an aggregated portfolio view without requiring navigation to individual programme records. The page header displays the authenticated user's name and job title.
Summary Stat Cards
Three headline metric cards are rendered across the top of the dashboard:
Total Programs
The count of all active programmes registered within the organisation.
On Track
The count of programmes whose status is classified as On Track in the current reporting cycle.
Total Indicators
The aggregate count of all active indicators tracked across the full programme portfolio.
Portfolio Charts
Recent Programs Table
A tabular list of the five most recently created active programmes. Each row displays the programme name, status badge, and start date. The Manage action navigates directly to the full programme detail page. The View All control at the table header navigates to the Projects Registry.
Projects Registry
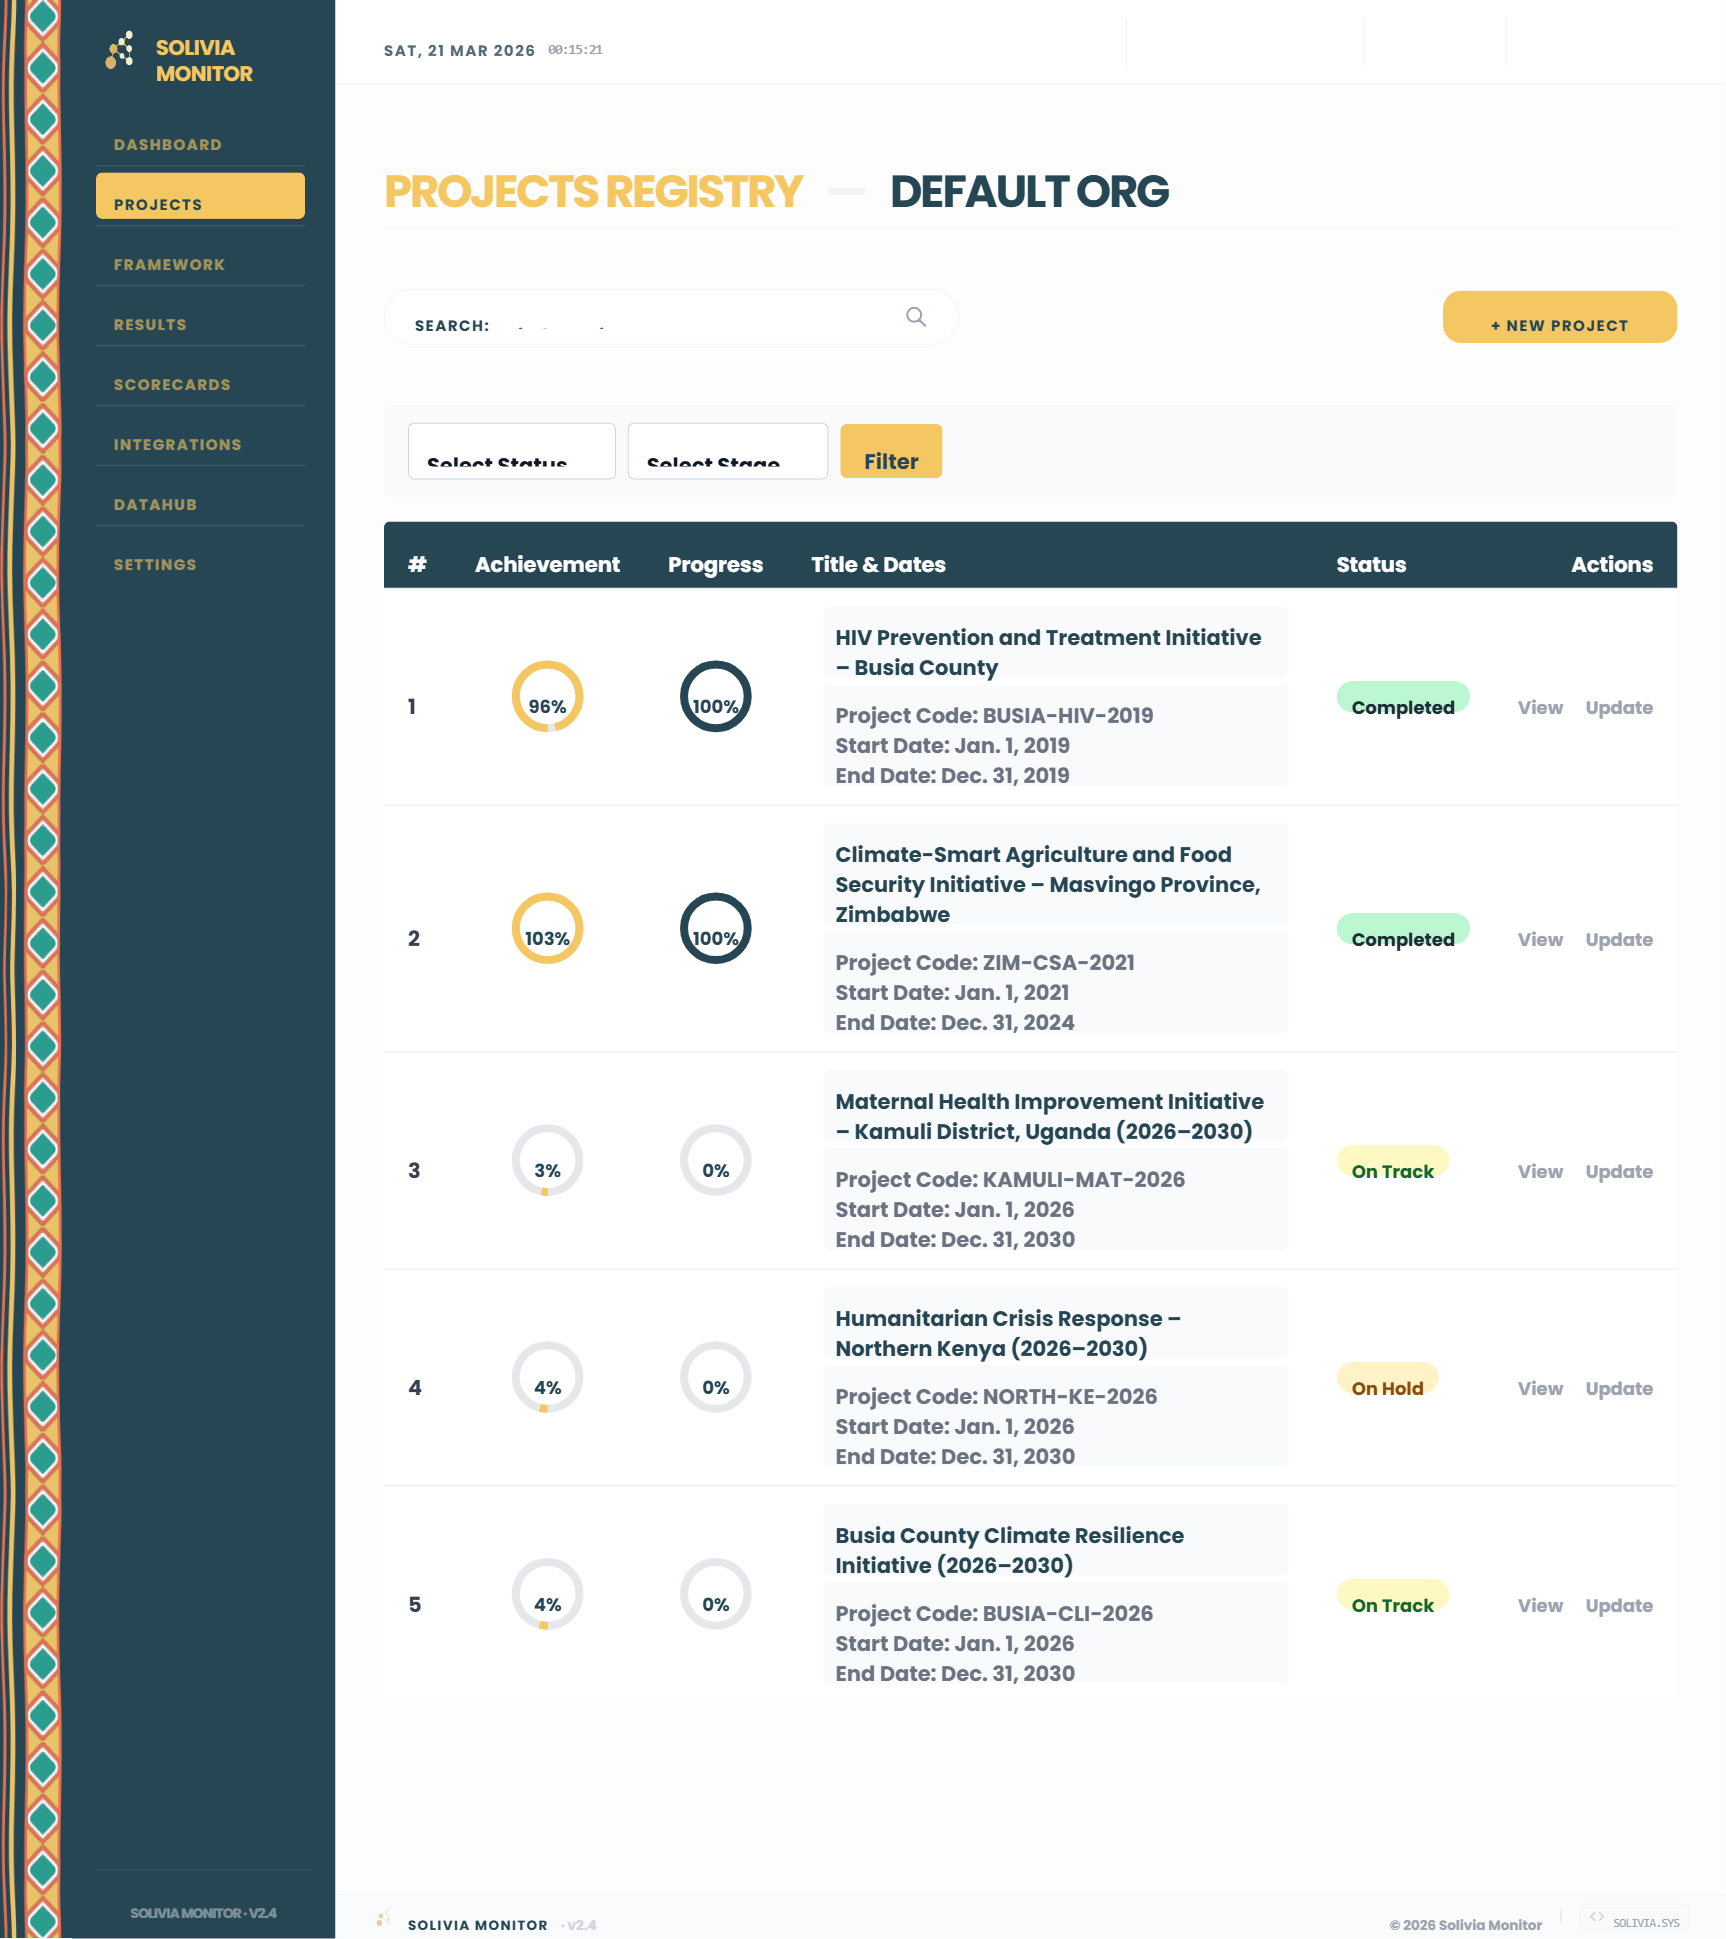
The Projects Registry maintains the master list of all programmes within the organisation. Records can be searched by title or code, filtered by operational status or developmental stage, and navigated to for in-depth execution management.
Toolbar Controls
Filter Bar
Programme Table Columns
Programme Detail Page
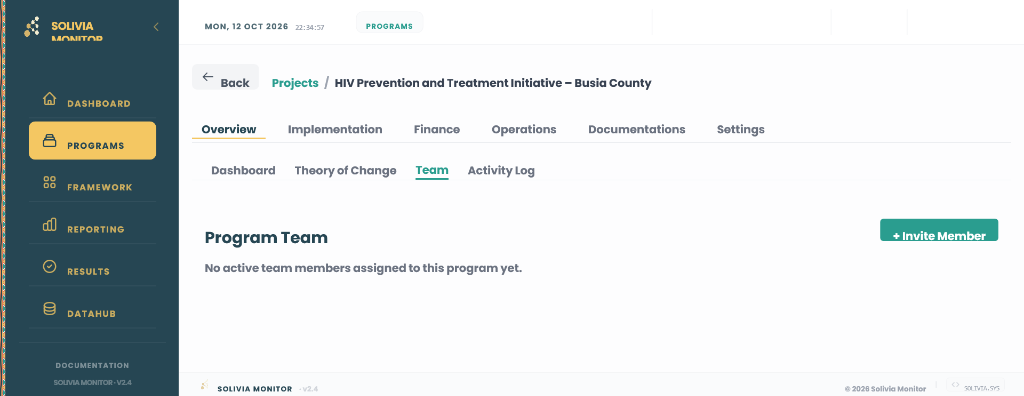
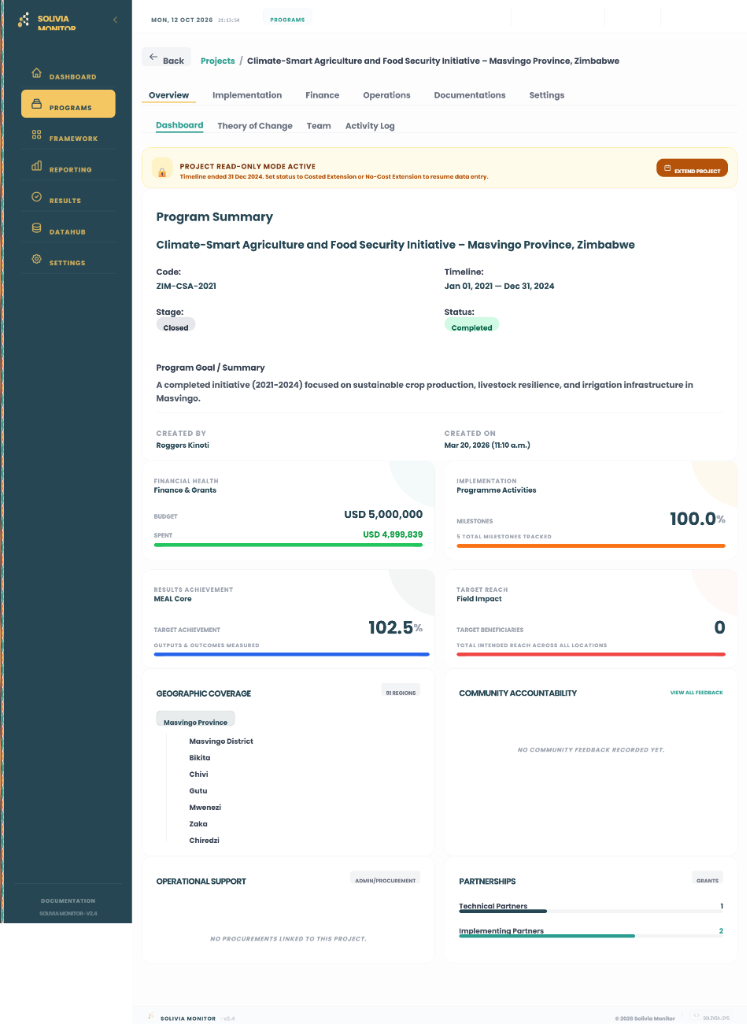
The Programme Detail page is accessible from the Projects Registry via the View action, or from the Dashboard via any Manage link. The page is structured around six comprehensive functional modules, each containing specialized sub-tabs covering all operational, financial, and strategic dimensions. Tab state is preserved in the URL query string, enabling direct bookmarked linking to any section. An Export PDF button produces formatted reporting briefs.
Module Tab: Overview
The Overview tab presents the programme summary in a responsive layout combining headline narrative descriptors with executive statistics.
Module Tab: Implementation
The Implementation module consolidates field execution tracking into three specialized sub-tabs:
Sub-tab: Milestones/Workplan
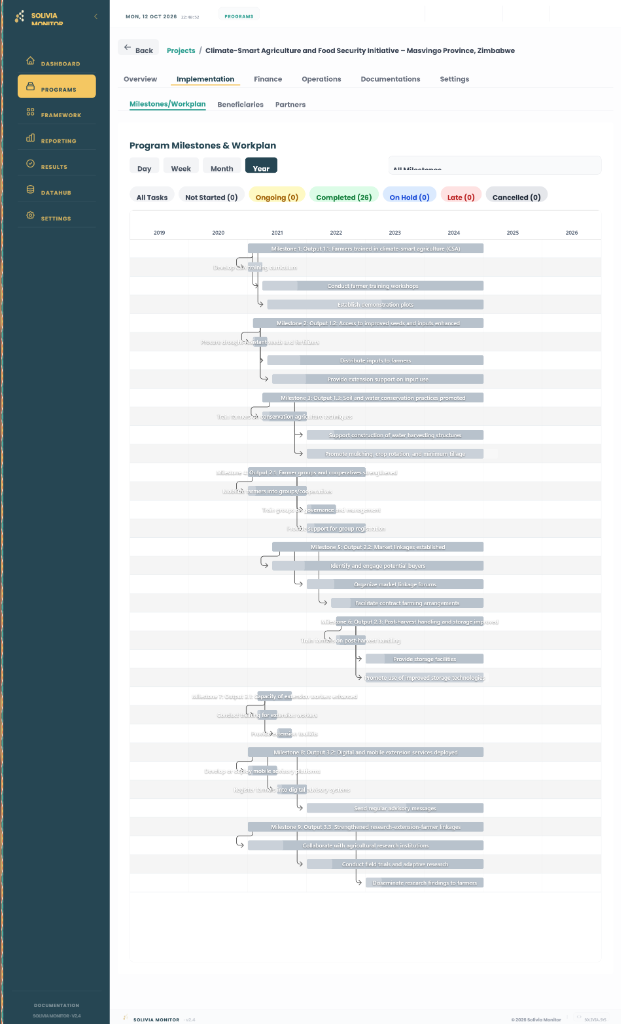
An interactive Gantt chart tracking all output-level milestones and nested activities:
View Controls: Day, Week, Month (default), and Year zoom buttons (Year is auto-selected for durations exceeding 365 days).
Status Filters: Filter pills for All Tasks, Not Started, Ongoing, Completed, On Hold, Late, and Cancelled with counts.
Interactive Bars: Colour-coded Gantt timeline bars (Green = Completed, Amber = Ongoing, Red = Late, Blue = On Hold, Dark Grey = Cancelled) with detailed tooltips displaying date ranges and status.
Sub-tab: Beneficiaries
Multi-dimensional reach analytics disaggregated by participant category and geography:
Summary Cards: Target Beneficiaries (Planned total by gender), Direct Targets (direct recipients), and Indirect Targets (community spillover).
Location Breakdown Tree: Hierarchical drilldown tree (e.g. County → Sub-County → Ward) with searchable expandable nodes displaying demographic matrices (Male, Female, Total).
Interactive Map: Leaflet.js map with circle markers positioned at programme sites, with radii proportional to participant counts.
Sub-tab: Partners
Comprehensive partner and donor management dashboard:
Summary Cards: Total Donors, Total Contribution Received, Active Partners, and Pending Disbursements.
Visual Analytics: Donor Contribution Progress donut, Partner Type Distribution donut, Top 5 Donors bar chart, and stacked Disbursements Over Time chart.
Master Ledgers: Paginated Partners table (Type, contact, address, downloadable ToR) and Donors table (Funding type, contributed amounts, disbursement schedule, contract document).
Module Tab: Finance
The Finance module provides complete fiscal oversight across six dedicated sub-tabs:
High-level financial KPIs: Disbursed Rate %, Burn Rate (Spent ÷ Disbursed), Available Cash Balance, Cost per Beneficiary, Runway analysis, and Next Quarter deficit risk indicator.
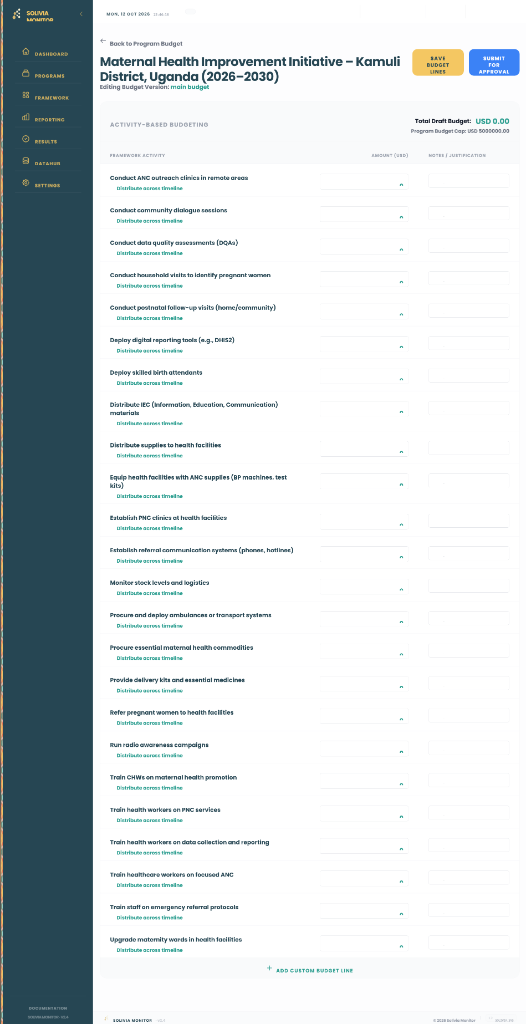
Granular programme budget line-items, category cost allocations, and multi-year budget revision tracking.
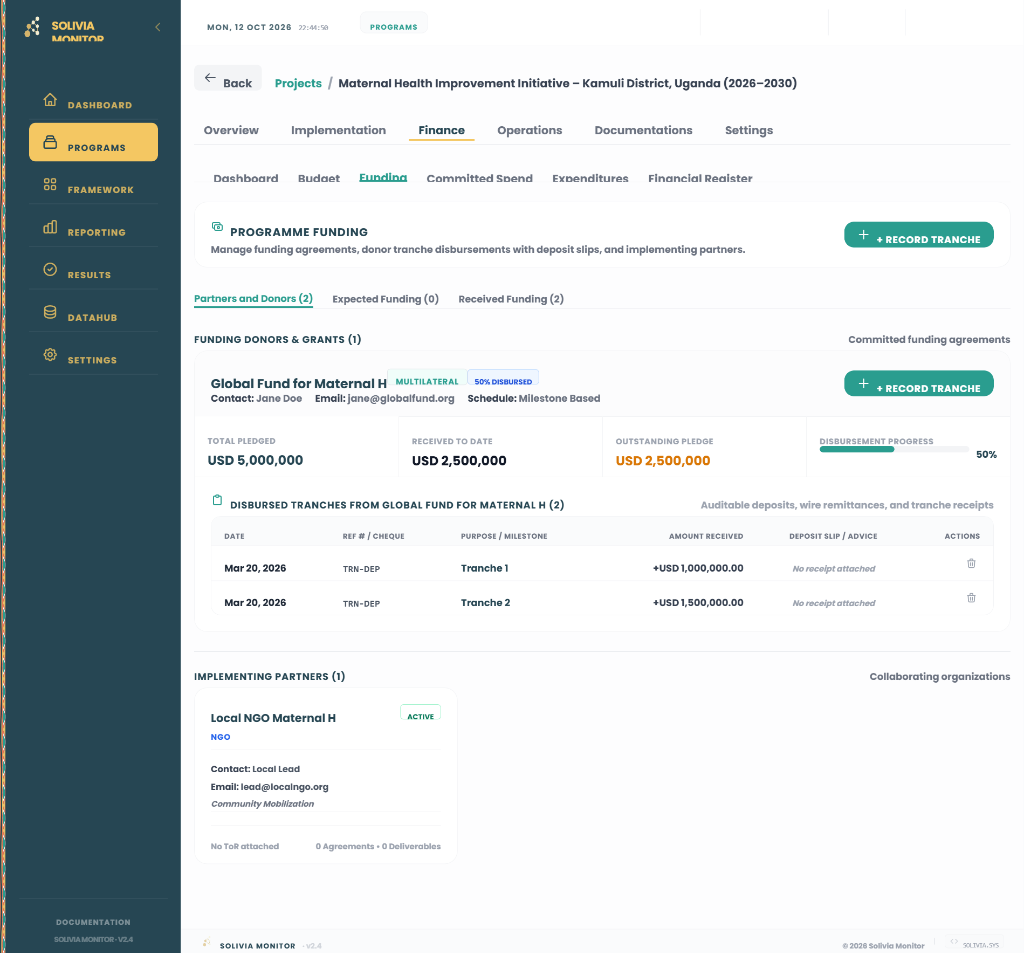
Committed donor contribution tranches, inflow schedules, and funding gap / deficit analysis.
Tracks purchase orders, operational commitments, and encumbered funds prior to actual disbursement.
Chronological ledger of actual expenditures (Date, Amount, Purpose, Receipt attachments) with pagination and sum totals.
Master reconciled transaction book comparing Budgeted vs. Committed vs. Disbursed vs. Spent amounts.
Module Tab: Operations
The Operations module governs programme logistics, procurement pipelines, and asset custody across six sub-tabs:
Multi-tier requisition, purchase, and payment approval workflows with role-based sign-off stages.
Supplier directory with tax registrations, performance ratings, banking info, and active contract files.
Purchase requests, RFQs, competitive bid analyses, contract awards, and purchase order tracking.
Fixed asset registry documenting asset tags, serial numbers, custodians, conditions, and locations.
Journal entries, payment vouchers, ledger postings, and financial balance reconciliations.
Operational custody, vehicle movement logs, compliance registries, and incident journals.
Module Tab: Documentations
The Documentations module serves as the programme's digital archive, structured into five specialized folders:
General document repository (Project proposals, MoUs, compliance agreements, photos) with download actions.
Formal programme progress reports (Monthly, Donor, Annual, Final) with executive summaries and attachments.
Baseline assessments, Mid-Term reviews, Endline evaluations, and external consultant reports.
Community feedback logs, complaints response mechanisms (CRM), and stakeholder engagement notes.
Chronological audit log tracking lifecycle changes, status transitions, and user modifications.
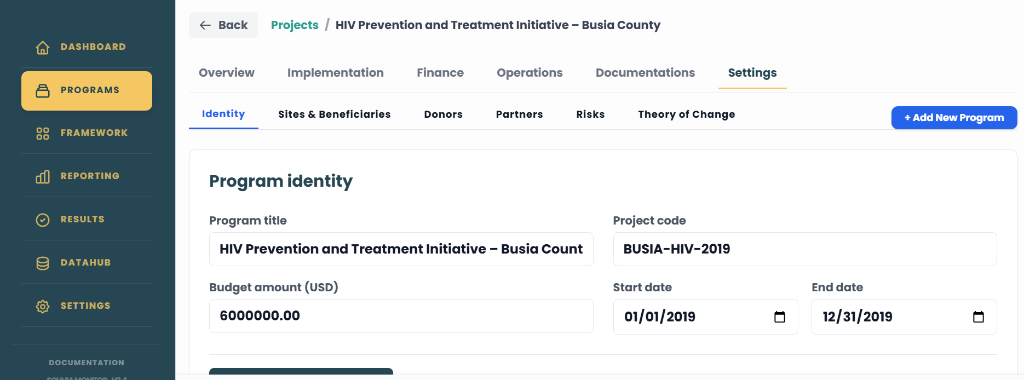
Module Tab: Settings (Program Settings)
Formerly located in Framework Maintenance, Program Settings has been moved to Programme Detail Settings to act as the primary configuration engine. Data entered here populates dropdowns and calculations system-wide across six inner sub-tabs:
Configure core programme title, total budget capacity, unique project code, start date, and end date.
Define overall planned participant reach benchmark to drive portfolio-wide reach calculations.
Register financial contributors, funding categories (Grant, Loan, Co-funding), and committed funding amounts.
Onboard external entities and explicitly assign operational roles (Implementing, Technical, Funding, Advocacy).
Maintain the foundational risk register with descriptions, likelihood ratings, impact ratings, and risk owners.
Wire the causal logic engine by explicitly linking Outputs to Outcomes using IF WE → THEN WE statements with explanatory rationales.
Strategic Framework
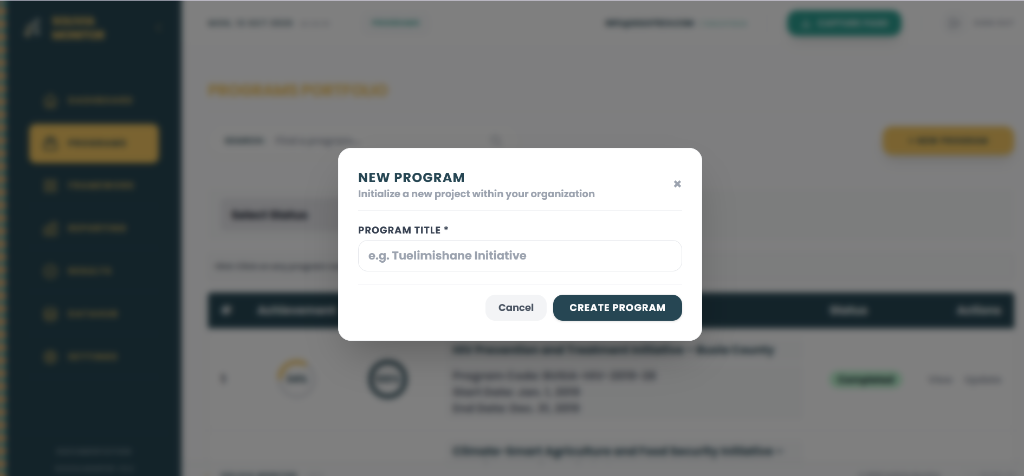
The Strategic Framework module provides the core interface for defining and maintaining the logical hierarchy of a programme — connecting overarching Goals to Outcomes, Outcomes to Outputs, and Outputs to Activities and Indicators. A programme selector dropdown at the top allows switching context seamlessly. The + Add New Program button opens a modal to provision new logframes directly.
Tab: Builder
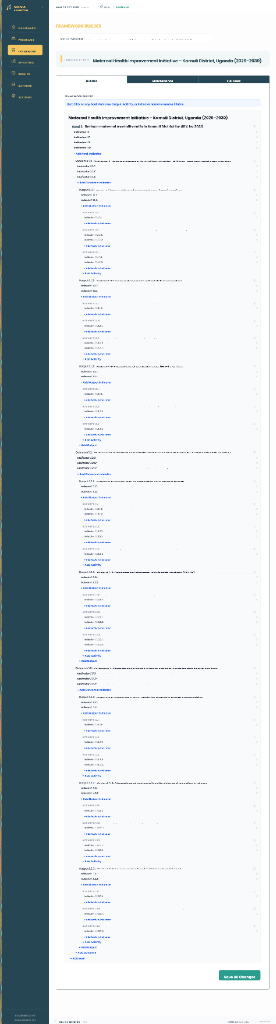
The Builder tab is an interactive hierarchical canvas for architecting the Theory of Change structure. Users can build, rename, and nest Goals, Outcomes, Outputs, Activities, and Indicators in real time with immediate database persistence. Each node includes inline controls for quick creation, renaming on blur, and node deletion.
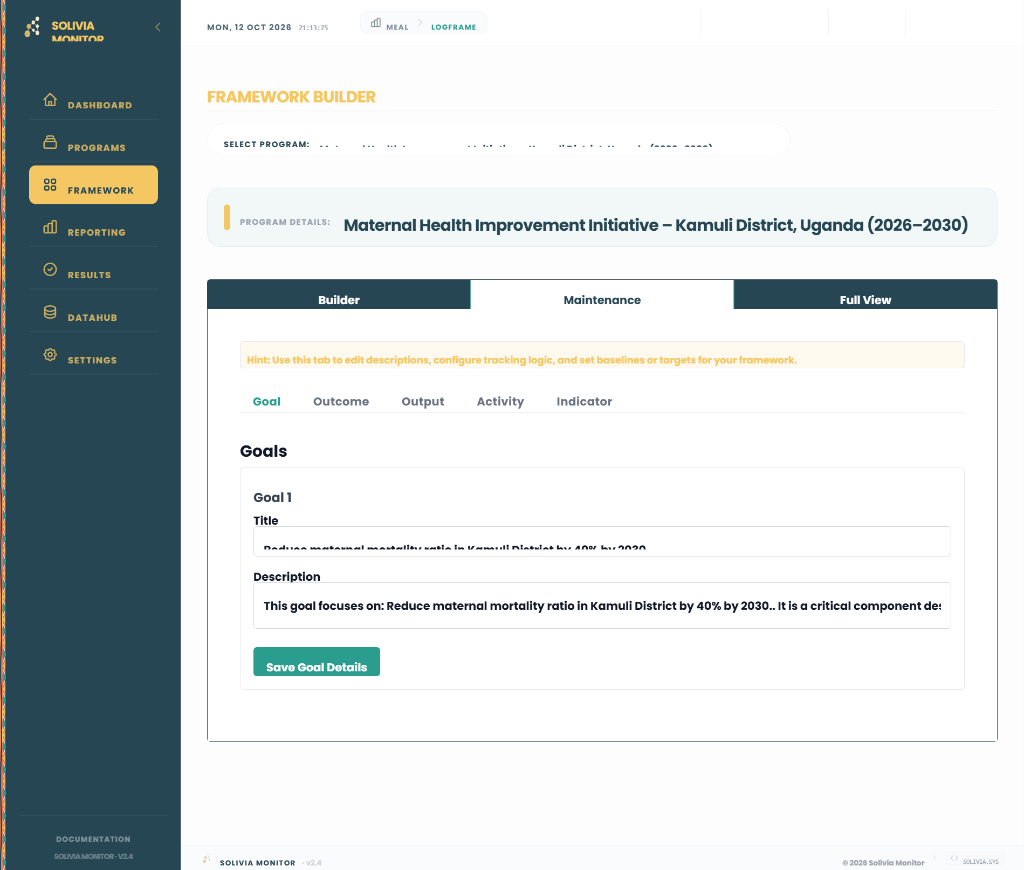
Tab: Maintenance
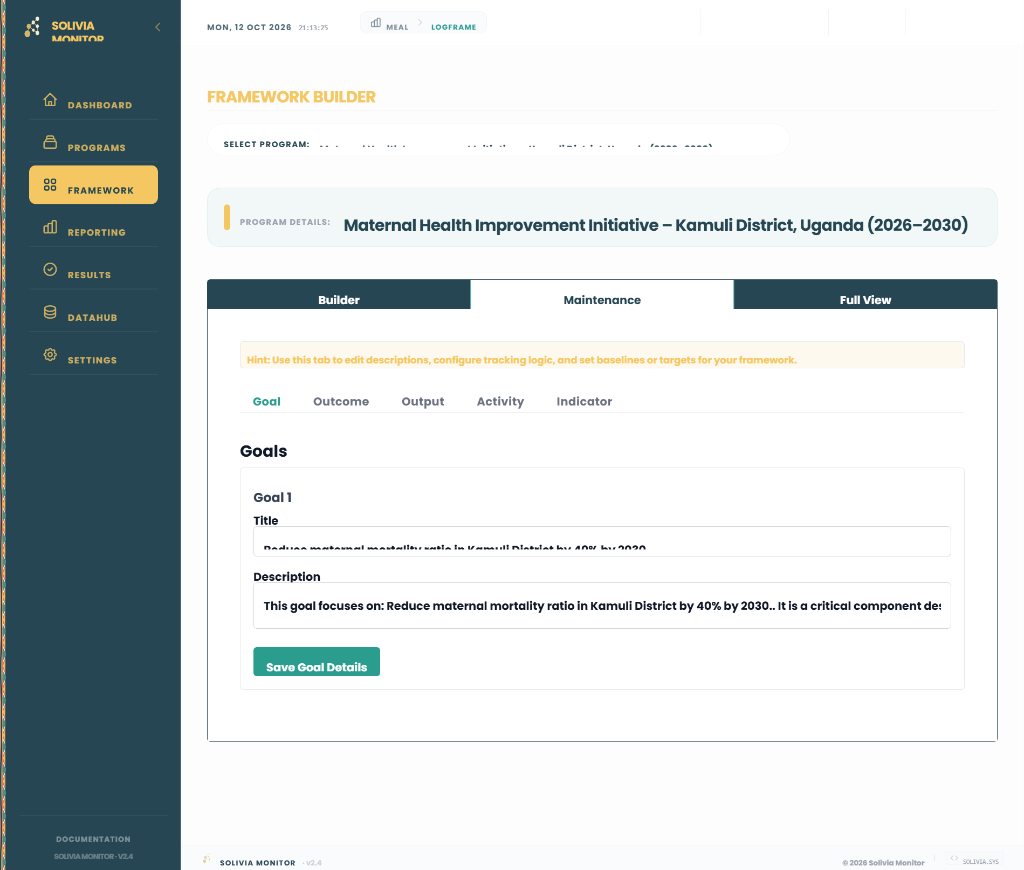
The Maintenance tab provides a dedicated granular editing interface for all logframe entities. With Program Settings moved to Programme Detail, Maintenance focuses strictly on the five logical Theory of Change levels:
The most comprehensive configuration sub-tab, governing all indicator measurement parameters:
- Core Configuration: Indicator Name, Description, and Logical Level (Goal, Outcome, Output).
- Measurement Rules: Indicator Type (Percentage, Rate, Proportion, Average, Boolean, or Number) and reporting Frequency.
- Cross-cutting Disaggregations: Multi-select assignment of disaggregation options (e.g. Gender, Age Brackets).
- Targets: Base numeric Baseline value, cumulative Target value, and Means of Verification (MoV).
- Manual Data Injection: A secondary form to inject historical or ad-hoc actual values outside the main Reporting module, complete with Organisational Unit assignment, calculation components (Numerator/Denominator), disaggregated values, and narrative notes.
Tab: Full View

The Full View tab renders a read-only, top-down visual logframe representation of the complete programme architecture in a single scrollable view. Designed for stakeholder reporting, logical verification, and donor compliance audits.
Program Reporting
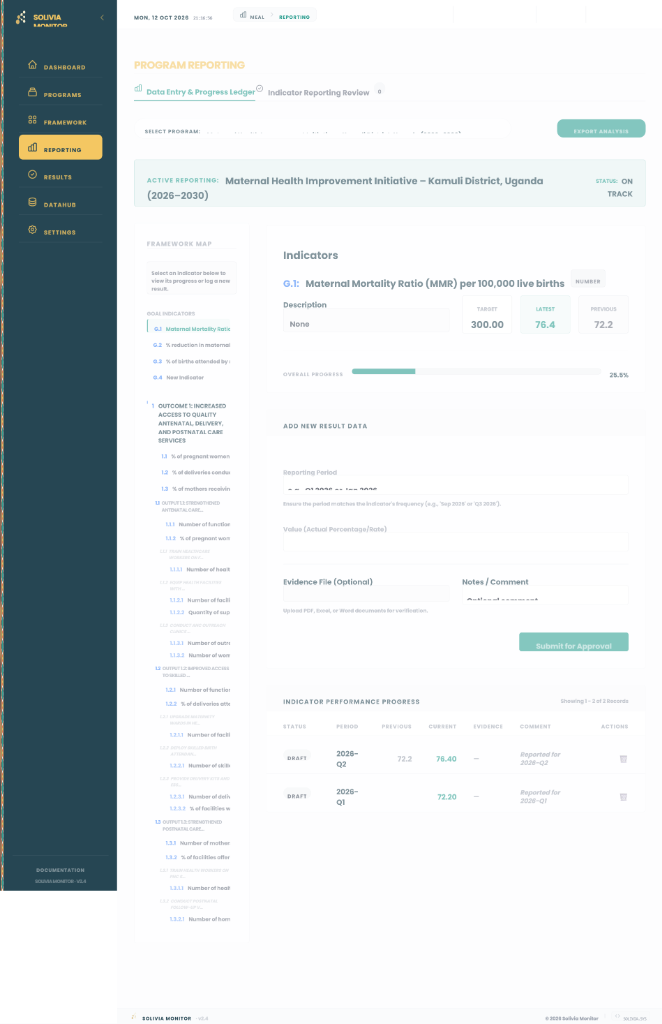
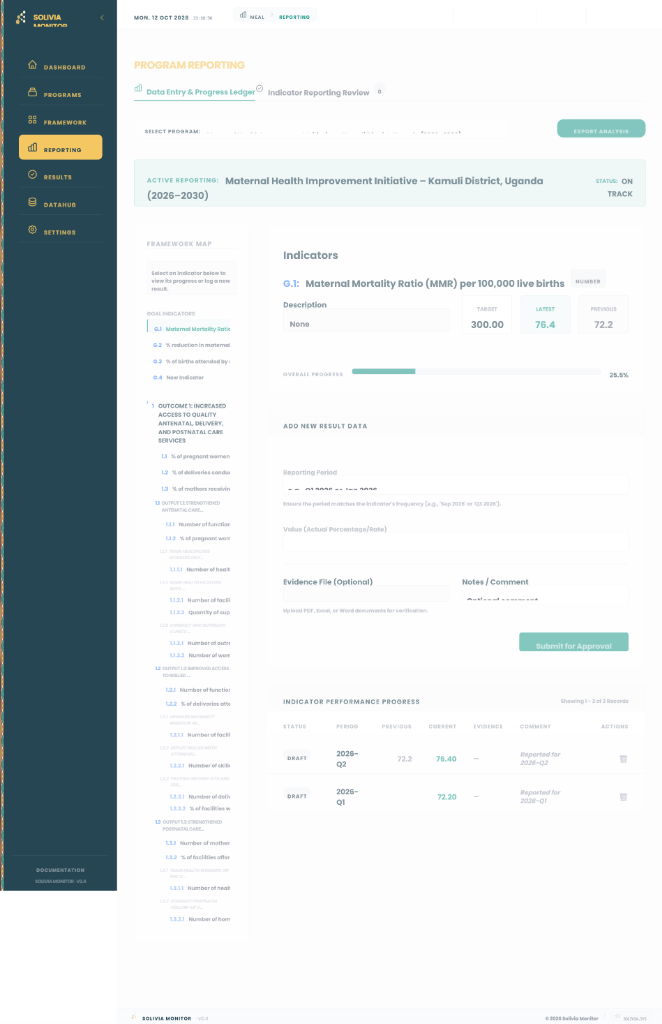
The Reporting module serves as the primary operational hub for field data collection and M&E quality control. Accessible via Reporting in the sidebar, it incorporates a split-pane data collection interface alongside an enterprise-grade segregation-of-duties review workflow.
Top Tab: Data Entry & Progress Ledger
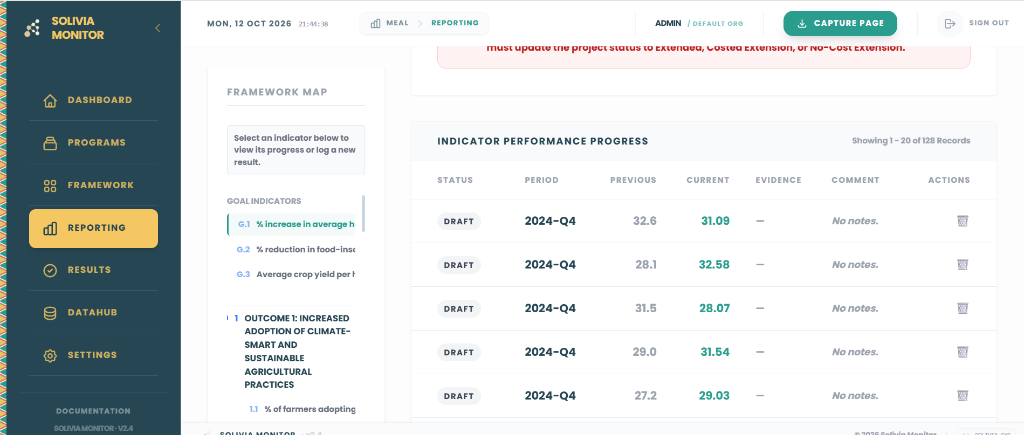
Top Tab: Indicator Reporting Review
A dedicated Quality Control panel implementing strict segregation of duties. M&E managers and administrators review submitted indicator actuals before they are factored into official scorecard calculations:
Program Results & Scorecards
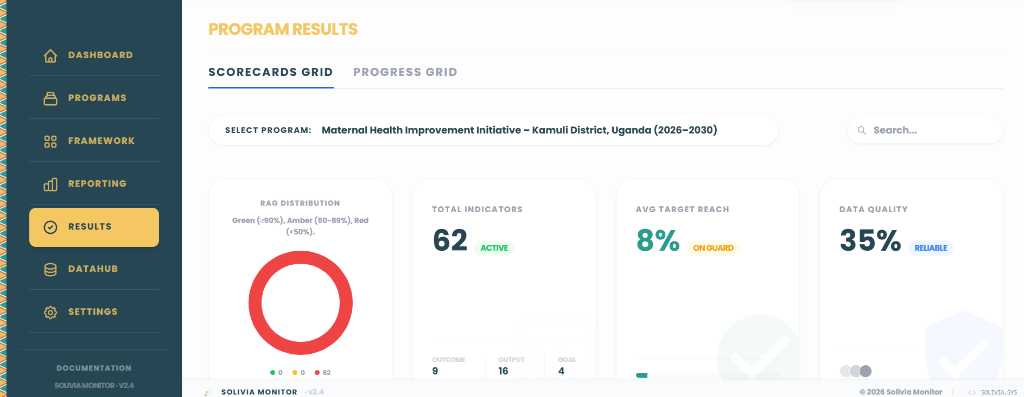
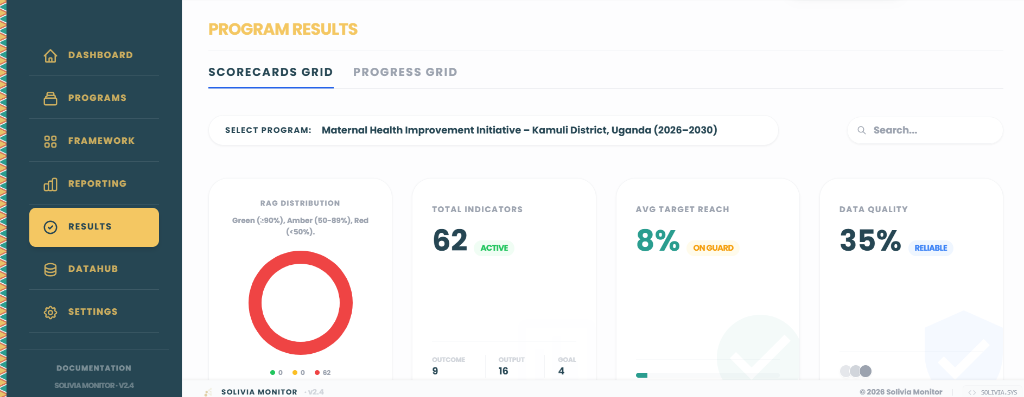
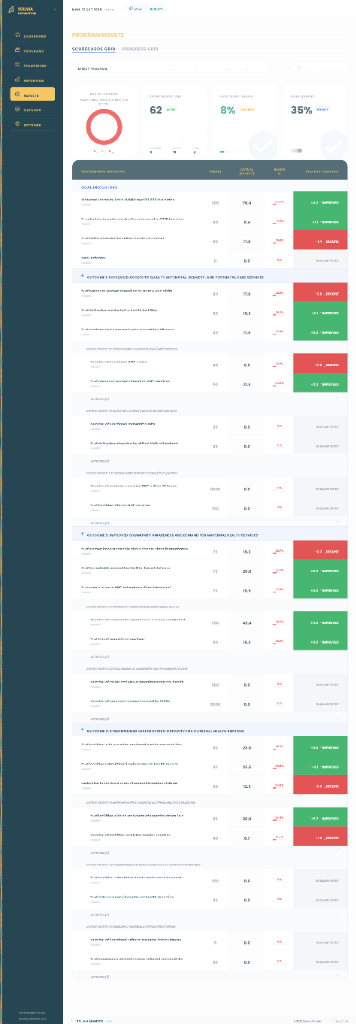
The Results module (accessible via Results in the sidebar) delivers automated performance intelligence derived directly from verified data entries. It features executive visual KPIs alongside an algorithmic RAG scorecards ledger across two specialized tabs.
Tab: Scorecards Grid
Tab: Progress Grid
The Progress Grid provides a multi-period execution matrix comparing planned milestone targets against cumulative achievements over time:
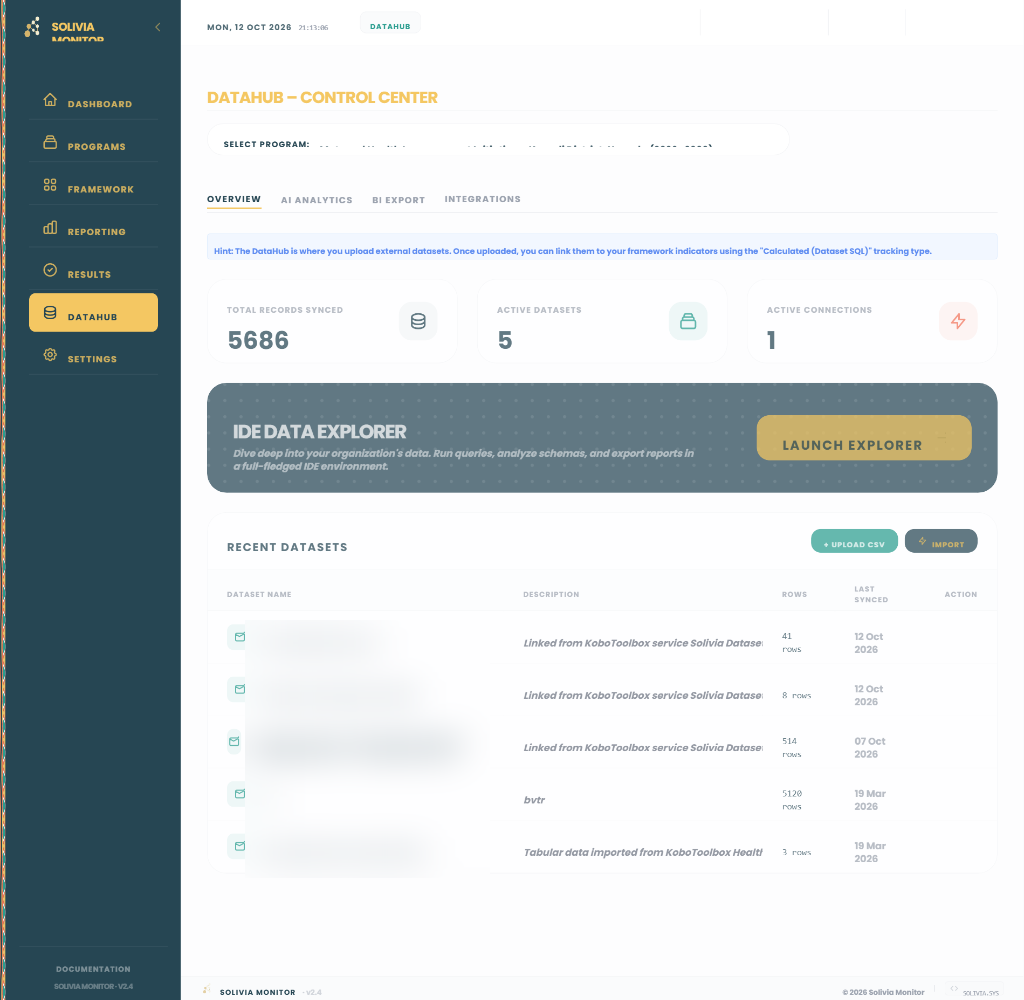
DataHub — Control Center
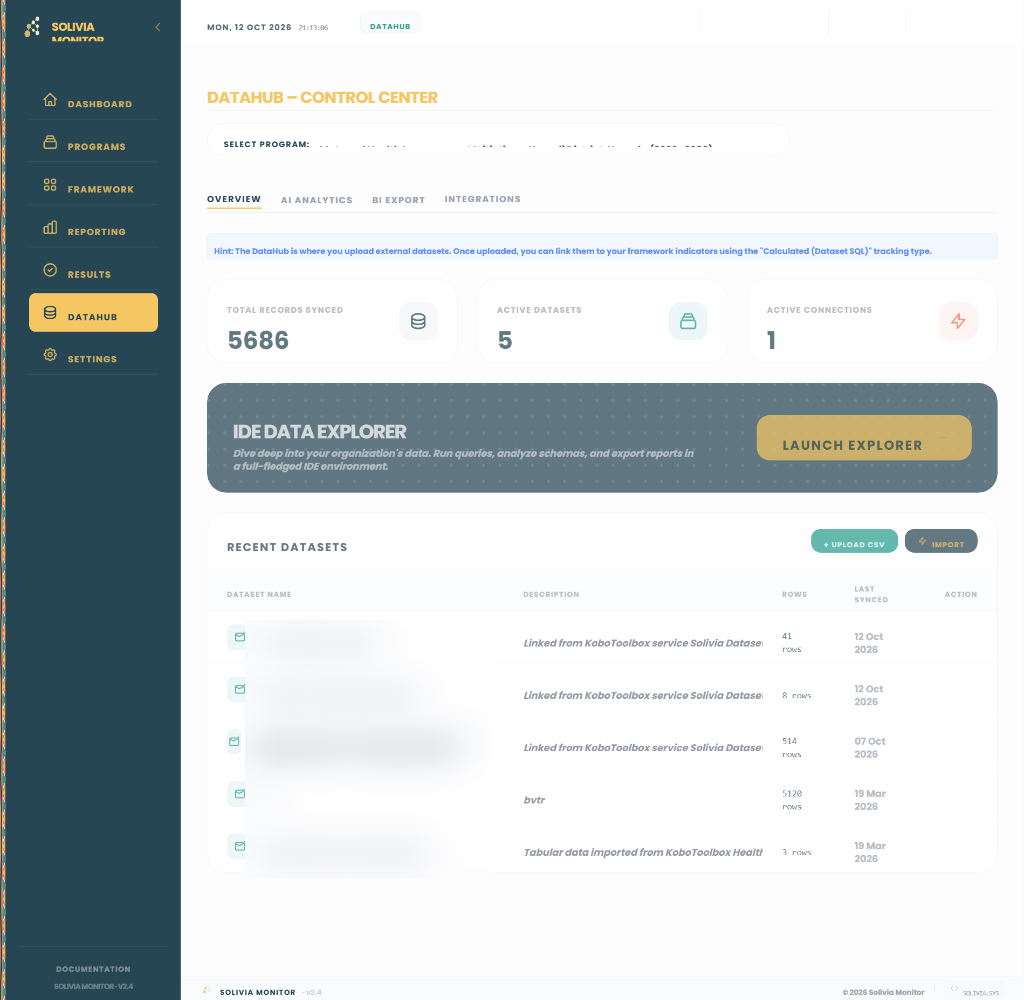
The DataHub centralises all external datasets, automated AI analytical capabilities, and business intelligence export feeds. A programme selector dropdown at the top filters content by programme context across three operational tabs.
Tab: Overview (Datasets)
Tab: AI Analytics
/framework/api/magic/stream/).Tab: BI Export
/api/v1/analytics/programs/), Indicator Progress (/api/v1/analytics/indicator_progress/), and custom dataset tables.Data Integrations
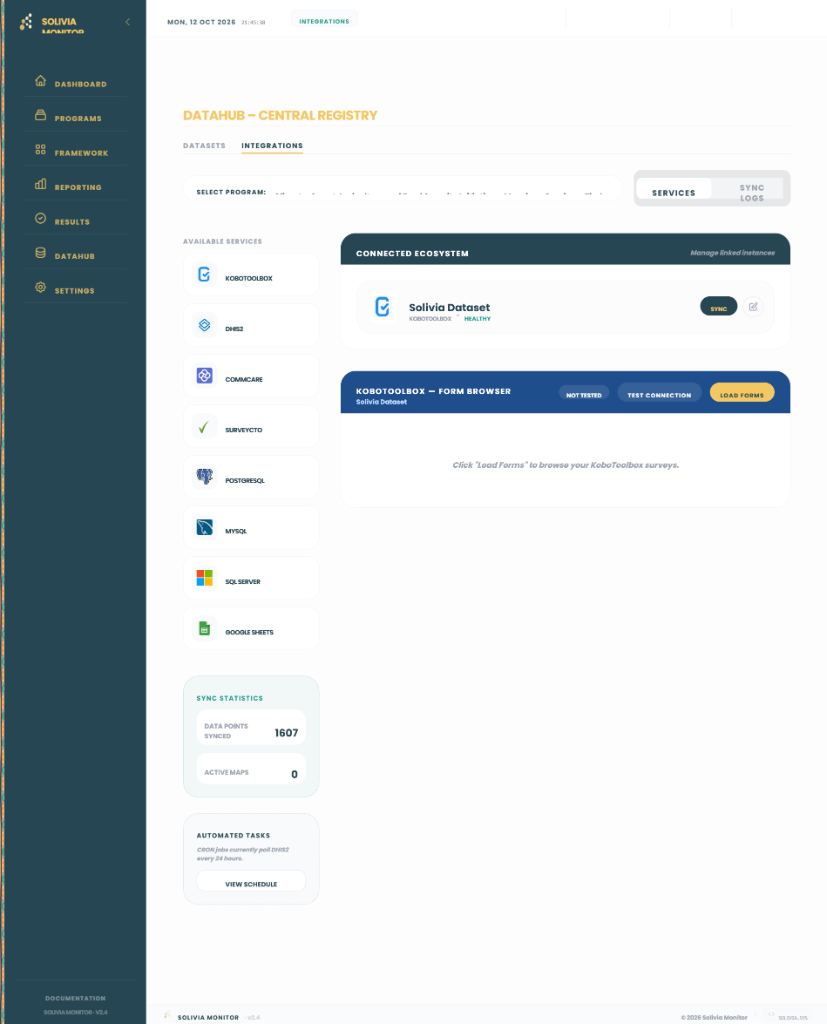
The Integrations module enables automated synchronization with third-party survey tools, mobile data collection engines, and external SQL database servers. It is organised into two primary operational tabs:
Tab: Services
Tab: Sync Logs
Organisation Settings
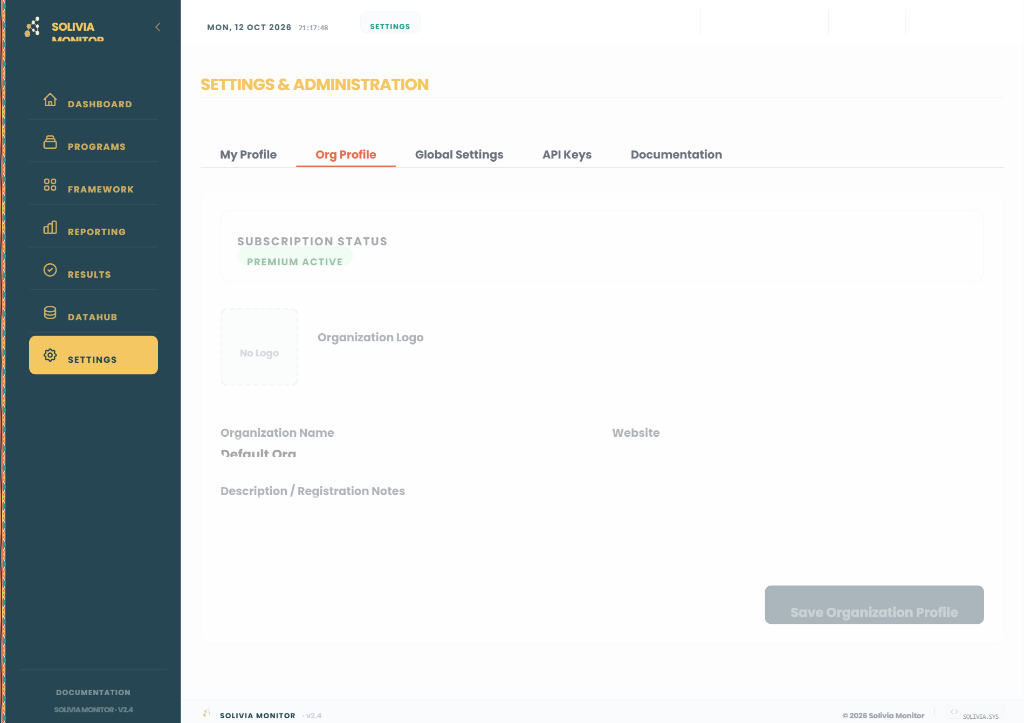
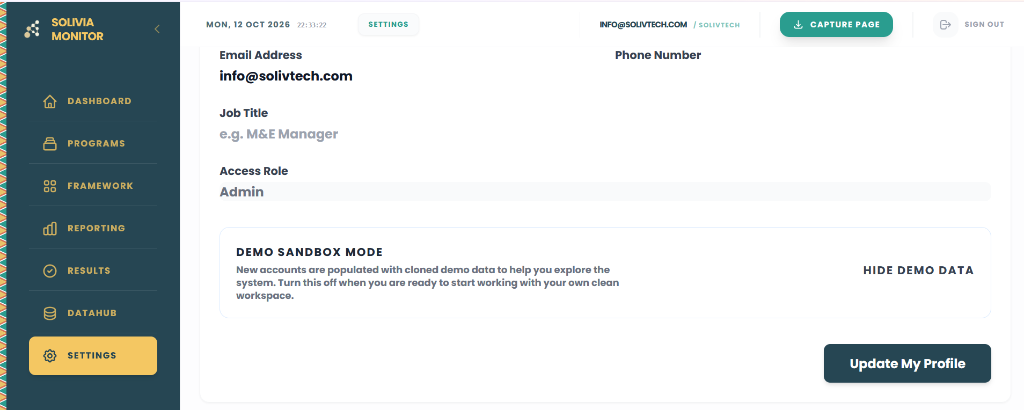
The Settings page is restricted to users with the Administrator role. It provides governance controls for organisation branding, system-wide defaults, programmatic API security, and platform user administration across four dedicated tabs:
Tab: Profile
Tab: Global Settings
Tab: API Keys
Tab: Team Management
Accessible directly from the Settings tab bar. Administrators can invite users by email, assign platform roles (Admin, Manager, Viewer), manage permissions, and deactivate accounts. This section governs organization-wide user accounts, distinct from programme-level assignments managed within Programme Detail.
Solivia Monitor · System Documentation · v2.0
For API integration reference, consult the BI Export section within DataHub and API Keys within Settings.